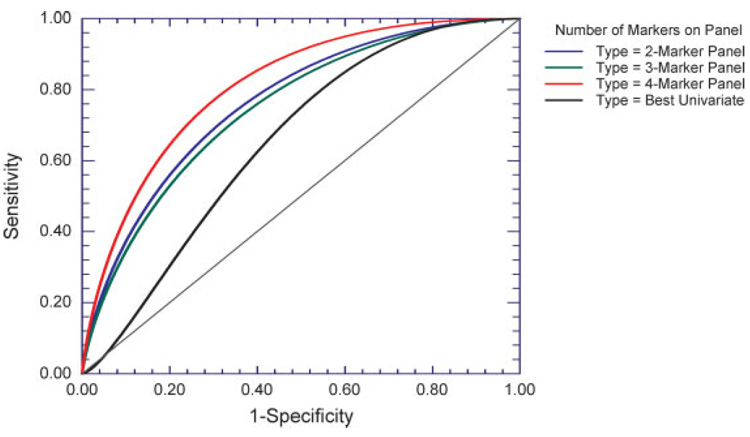
Figure 2.
Empirical ROC curves, constructed from per patient averages of test-set prediction probabilities generated using logistic regression with permutation resampling. Data were resampled 10 000 times into training sets and test sets for logistic regression using panels of 2–4 factors. For each sample, the >2000 prediction probabilities resulting from when it was resampled into test sets were averaged together, and ROC curves were based on these per-patient averages. The four multivariate most informative markers used in the panels are ranked in order as follows: IL-8, HGF, MIG, and IL-12p40; rankings utilize the marker r2 of Table 4. IL-5 was the univariately most discriminative marker, and was accordingly used univariately in the analysis.

