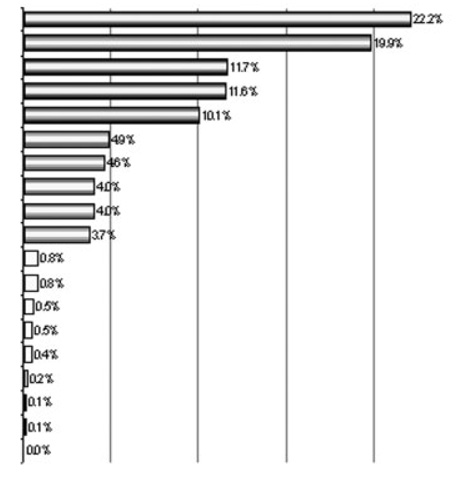
Table 4.
Discriminant Vector from MANOVA on All 19 Serum Factorsa)
| Serum factors | Vector coefficientsb) | Factor r2 with discriminant vector |
|---|---|---|
| IL-8 | 0.4708 |  |
| HGF | −0.4460 | |
| MIG | 0.3413 | |
| IL-12p40 | −0.3399 | |
| IL-5 | −0.3170 | |
| IP-10 | −0.2206 | |
| IL-6 | 0.2138 | |
| TNF-RII | 0.2008 | |
| MIP-1a | −0.2008 | |
| RANTES | 0.1929 | |
| EOTAXIN | −0.0909 | |
| IL-1a | −0.0883 | |
| TNFa | −0.0737 | |
| TNF-RI | 0.0700 | |
| IL-4 | −0.0653 | |
| IL-15 | 0.0422 | |
| IL-13 | −0.0324 | |
| G-CSF | 0.0316 | |
| EGF | −0.0129 |
Factors were transformed to log2, and standardized to zero mean and unit variance for extraction of discriminant vector via MANOVA.
The discriminant vector is normalized to length = 1.00, and points in direction of maximum separation between Benign and Malignant groups.
Factor r2 with discriminant vector are calculated as the squares of the vector coefficients, and add up to 100%. The five factors in the first group (r2s>10%; bold text) account for 75.5% of the total r2 with the gradient of separation between groups.
