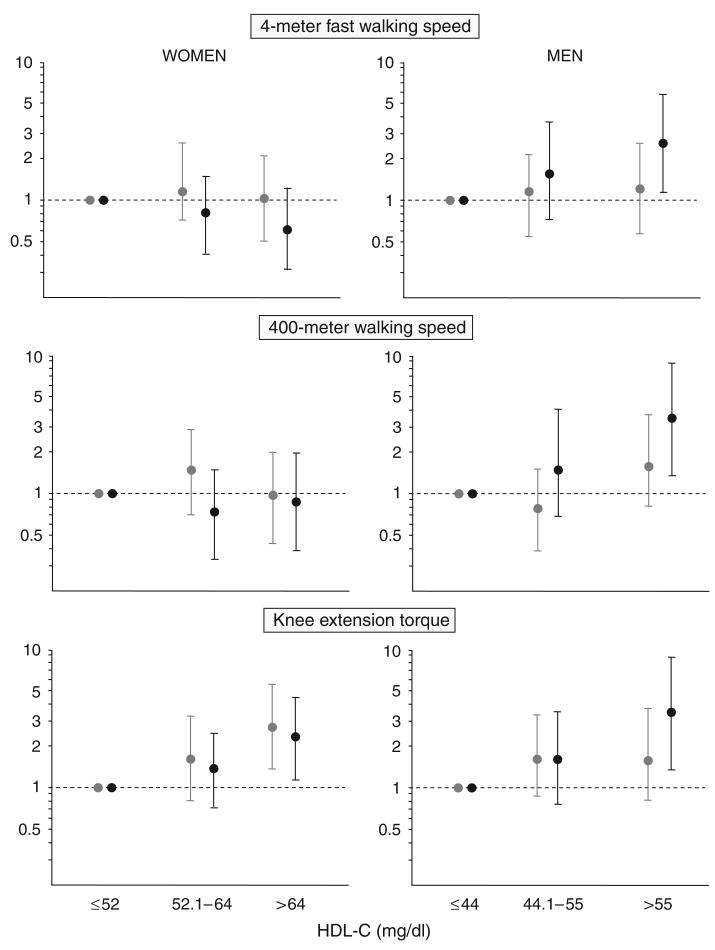
Figure 2.
Adjusted odds ratios (95% confidence intervals) comparing the likelihood of belonging to the highest (black) and intermediate (gray) tertile with that of belonging to the lowest tertile for 4-m fast walking speed, 400-m walking speed, and knee extension strength according to high-density lipoprotein cholesterol (HDL-C) levels and sex. Models are adjusted for variables included in Model 4 as described in Table 2.

