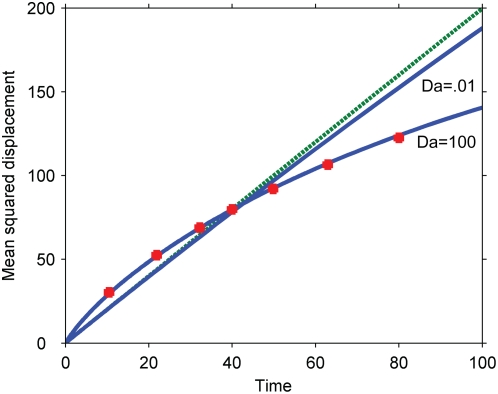
Figure 8. Mean squared displacement of the primary and secondary signals under the kinetics of Equation 3 (zero-order ultrasensitivity).
Dashed line, purely diffusive reference corresponding to the primary signal; solid lines, simulation results corresponding to γ = .01 and slow (Da = 100) and fast (Da = .01) diffusion; squares, theoretical prediction for slow diffusion corresponding to Equation 6. Simulations conducted with Km/cA0 = .01 (Equation 3).

