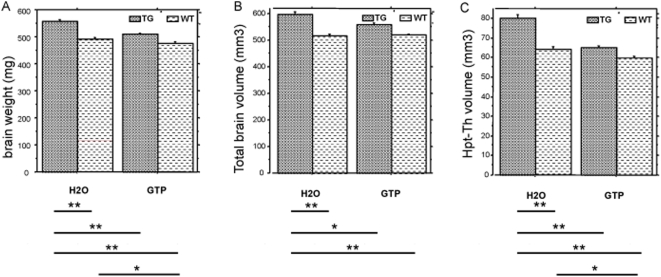
Figure 3. Effect of GTP treatment on DYRK1A-induced brain alterations.
A: weight of total brain (mg) in wild type (WT, n = 26), YACtg152F7 (TG, n = 13) water-fed (H2O) and in wild type (WT, n = 13), YACtg152F7 transgenic (TG, n = 18) green tea-fed GTP; B: in vivo MRI assessment of total brain volume (mm3) in wild type (n = 10) and YACtg152F7 transgenic (n = 10) water-fed (H2O) and in wild type (n = 9) and YACtg152F7 transgenic (n = 11) green tea-fed GTP; C: in vivo MRI assessment of hypothalamus-thalamus volume (mm3) in wild type (n = 6) and YACtg152F7 transgenic (n = 6) water-fed (H2O) and in wild type (n = 5) and YACtg152F7 transgenic (n = 7) green tea-fed (GTP). (Details of the MRI experiments in supp. data). ** for p<0.01; * for p<0.05.

