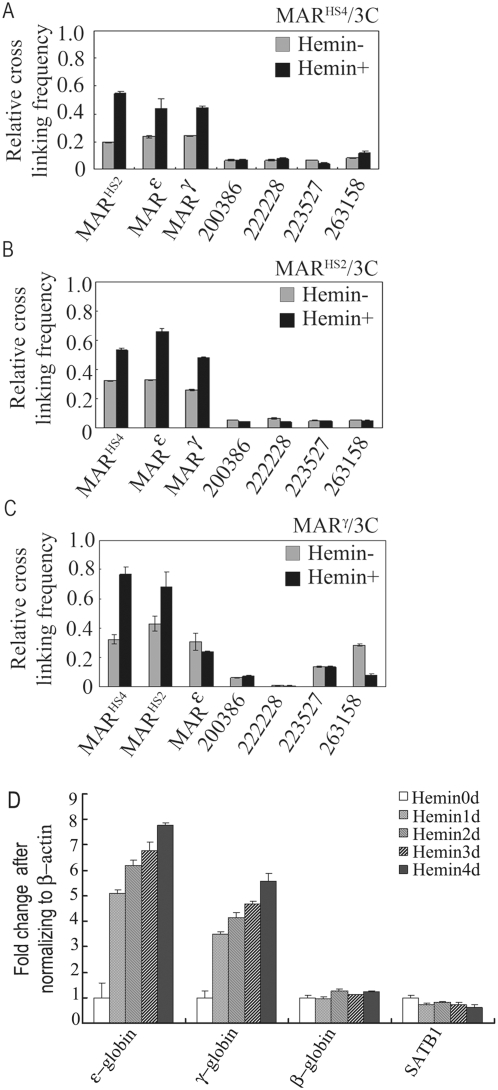
Figure 2. 3C assay of MAR associations and the expressions assay of β-like globin genes in both hemin induced and uninduced K562 cells.
The histograms show the association frequencies between the leader fragment and other tested fragments. The leader fragments are MARHS4 (A), MARHS2 (B) and MARγ (C) respectively. The tested fragments are shown along the X-axis and the leader is shown at top-right. Four fragments from other regions of β-globin gene cluster were also analyzed. The positions of the primers are shown in Fig. 1A. The Y values of the histograms represent the reading of PCR signal of two-tested fragments ligation product after normalization, which represent the ligation frequency of each pair of analyzed fragments (see materials and methods for details). The PCR-amplified re-ligation product from GAPDH locus was used to correct for the amount of DNA (the 3C templates DNA prepared from hemin uninduced K562 cells and hemin induced K562 cells) used in each PCR. Error bars represent the mean and standard errors from triplicate and averaged determinations. D. Quantified assay of the expressions of β-like globin genes during the hemin induction after normalizing to β-actin.

