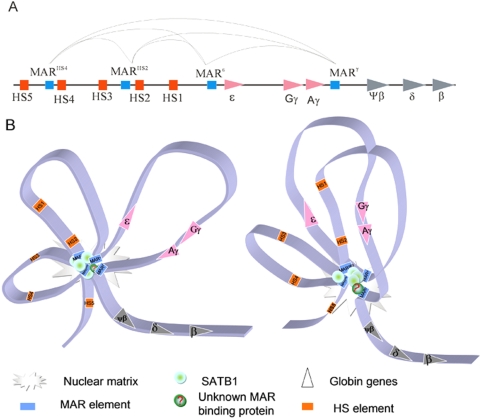
Figure 7. The MAR-core-loop model.
A. The diagram illustrates the genomic arrangement of β-globin gene cluster. The orange squares represent HS1 to HS5 and the blue squares represent the MAR elements. The triangles represent the β-like globin genes. The curves at the top indicate the interactions among the four MAR elements. B. The supposed spatial organization of β-globin gene cluster during terminal differentiation of K562 cells, a “MAR-core-loop” model. The green spheres represent SATB1 which mediates the association of MAR elements. It is noticeable that the MARγ is possibly recruited to the “MAR core” by unknown MAR binding protein(s). Spatial proximity of the loops provides the chance for establishment of the ACH. The left panel shows the loops extending from the “MAR-core” and the right panel shows the loop interactions mediated by “MAR-core”.

