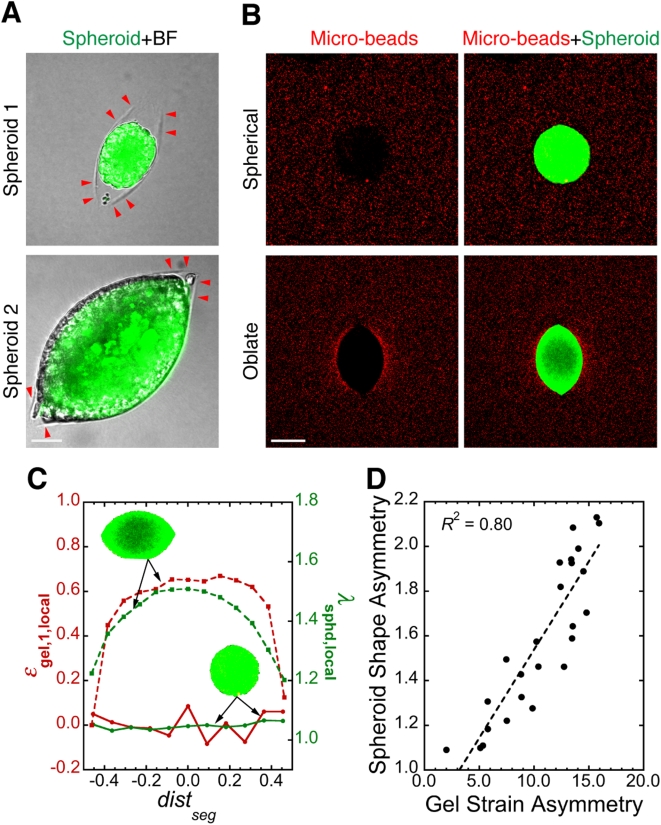
Figure 2. Mechanical stress distribution controls tumor spheroid shape.
(A) Agarose gel can fail under tension from growing tumor spheroids (green). Red arrowheads indicate the edge of planar cracks in the agarose gel (BF: bright-field image taken in Nomarski mode). Scale bar = 50 µm. (B) Spheroids (green) of different shapes and their surrounding stress fields visualized by micro-beads (red). Scale bar = 150 µm. (C) Relationship between local strain in agarose gel (ε gel,1,local) and local spheroid deformation (λ sphd,local) for the spheroids (green, inset) shown in A. dist seg is the distance of spheroid segments from spheroid center normalized over the length of the major axis. (D) Correlation between the asymmetry in spheroid shape and in the corresponding strain in the surrounding agarose gel, showing that spheroids are more deformed along the direction of higher stress. Each data point is for one spheroid. R is the linear regression coefficient; slope of the regression line is significantly greater than zero (p<0.0001). Methods for image analysis in C and D are described in Supplementary Methods S1, Supplementary Fig. S2, Movie S2 and Movie S3.

