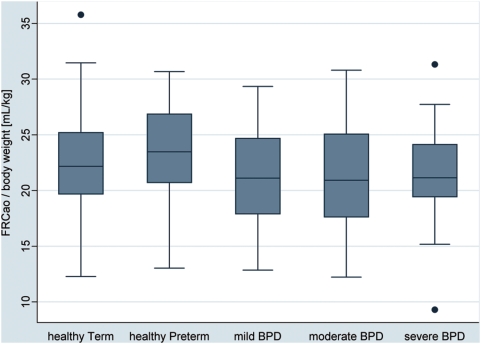
Figure 1. Box plots of the respective lung function values by subject groups.
Subjects were grouped according to post-conceptional age at birth (term-born and preterm) and according to disease state based on ATS definition of BPD (healthy preterm, mild, moderate and severe BPD) [6]. The boxes indicate the median and the 25th and 75th percentile, the whiskers the upper and lower adjacent values. Outside values are shown as separate dots. Box plots are shown for FRC at airway opening per weight in mL/kg.

