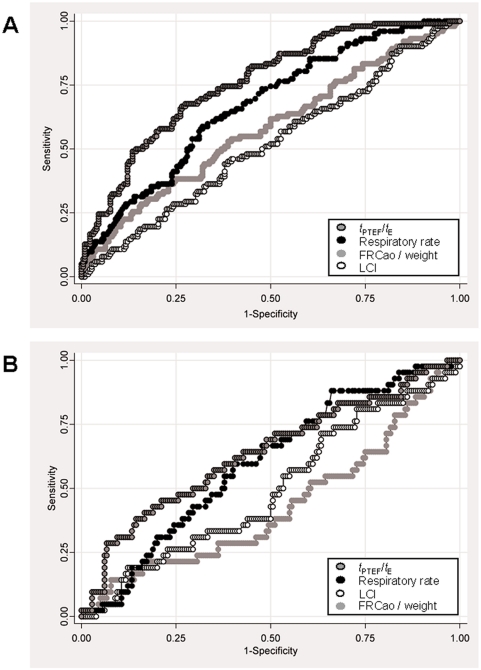
Figure 4. Receiver-operator characteristic (ROC) curves comparing t PTEF/t E (dark gray symbols with black outline), respiratory rate (black symbols), FRC per weight (light gray symbols without outline) and LCI (white symbols) between groups.
a) ROC curve comparing the ability of above mentioned lung function parameters to discriminate between healthy infants (term-born and preterm) and BPD infants using data of 221 healthy and 103 preterm infants. The resulting area under the curve is 0.58 for FRCao, 0.52 for LCI, 0.67 for respiratory rate and 0.76 for t PTEF/t E. b) ROC curve comparing the ability of above mentioned lung function parameters to discriminate between 179 term-born and 43 preterm healthy infants; BPD infants were not considered for this analysis. The resulting area under the curve is 0.43 for FRCao, 0.50 for LCI, 0.60 for respiratory rate and 0.64 for t PTEF/t E.

