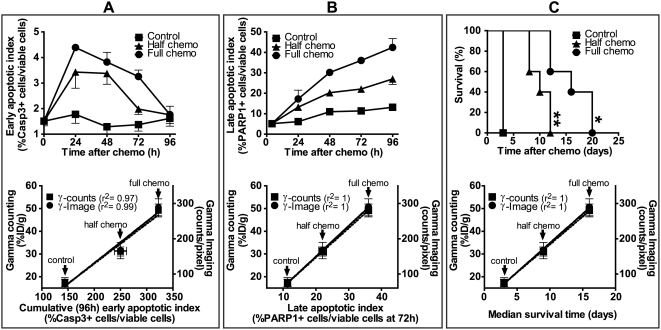
Figure 5. Graphical comparisons of apoptotic indices, tumor accumulation of DAB4, and survival of tumor-bearing mice.
EL4 tumor-bearing mice were untreated (Control) or treated with half- or full-dose chemotherapy. Early and late apoptotic cells were identified in tumor sections by staining for activated caspase-3 and cleaved PARP-1, respectively. Using phase color analysis, apoptotic cells were counted and expressed as a percentage of viable cell number to create an apoptotic index. Upper row of panels show time courses of A, early apoptotic index, and B, late apoptotic index, or C, Kaplan-Meier survival analysis of control mice and treated mice (** P<0.01 for half-dose chemotherapy versus control, * P<0.05 half-dose chemotherapy versus full-dose chemotherapy). In the lower row of panels, peak tumor accumulation of DAB4, which was measured using either gamma counting (%ID/g) or gamma camera imaging (counts/pixel) 72 h post-chemotherapy, was plotted as a function of A, the cumulative early apoptotic index, which represented mean %(number of activated caspase-3+ cells×h)/(number of viable cells)±SEM (n = 3/group), or B, the late apoptotic index, which represented mean %(number of PARP-1+ cells)/(number of viable cells)±SEM at 72 h (n = 3/group), or C, the median survival time (n = 5/group). Regression coefficients (r2) for fitted lines are displayed in brackets next to each curve. Chemotherapy-induced tumor apoptosis correlated with both tumor accumulation of DAB4 and survival of tumor-bearing mice.

