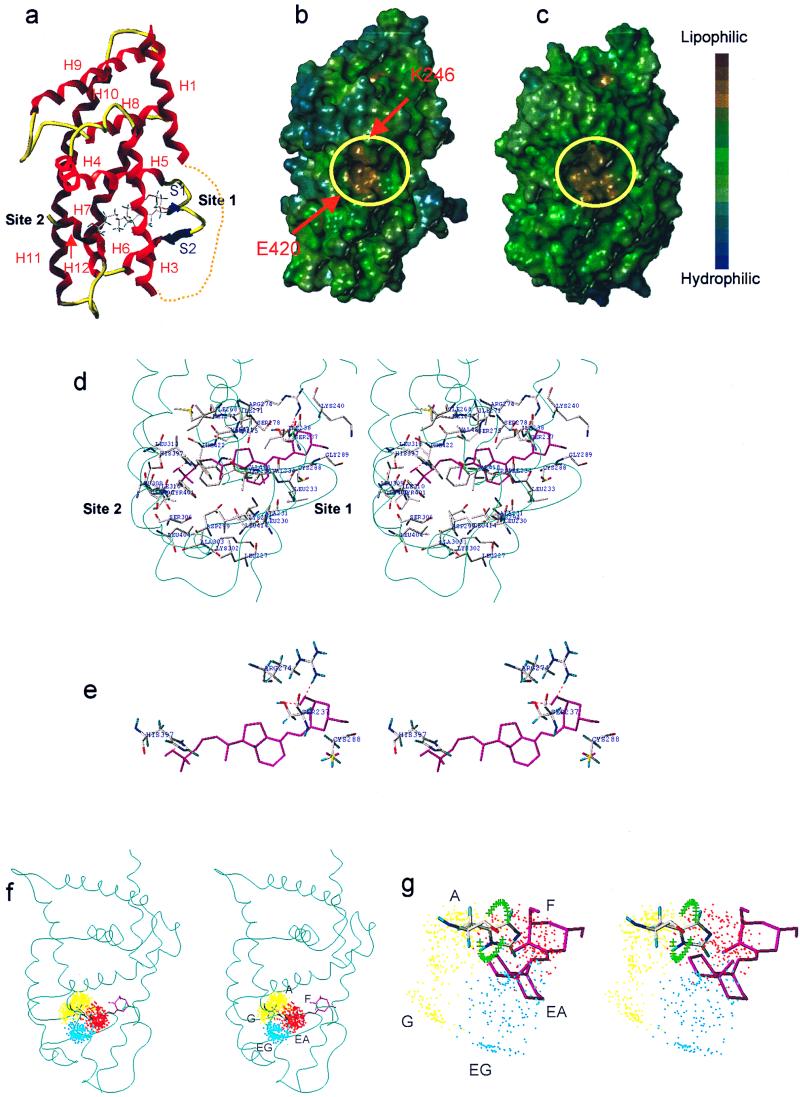
Figure 3.
(a) Ribbon-tube presentation of the VDR-LBD model. Dotted line shows eliminated loop 1–3. (b and c) Lipophilic potential surface of the VDR-LBD (b) and the RARγ-LBD (c). The AF-2 surface is surrounded by yellow circles. Arrows show the charge clump (K246 and E420). (d) Amino acid residues forming the ligand binding cavity and their interaction with 1,25-(OH)2D3 (cyan ribbon represents the backbone, stereo view). (e) The residues interacting with 1,25-(OH)2D3 (stereo view). (f) Side-chain dot map model in VDR (stereo view). (g) Enlargement of f (stereo view). The green crosses show the trace of the histidine NH when the χ2 of H397 was rotated 360° with 10° intervals. The regions about 2 Å away from the crosses are possible hydrogen-bonding areas.

