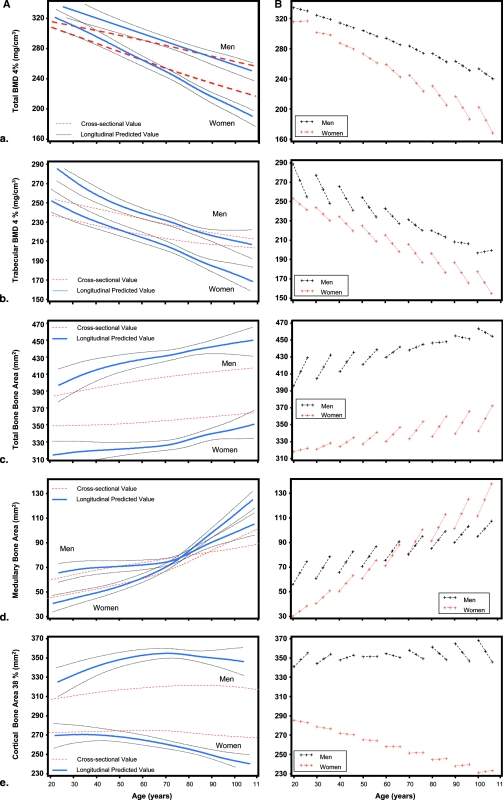
FIG. 1.
(Right panels) Longitudinal changes in total BMD (vBMD) (A), trabecular BMD (vBMDt) (B), total bone area (tCSA) (C), medullary bone area (D), and cortical bone area (E) during the 6-yr follow-up according to baseline age decade, from 20 to 100 yr, in men and women. (Left panels) Age-related trajectories of the bone parameters during life span estimates from the cross-sectional (red line) and longitudinal data (blue line) and their 95% CIs (black lines).

