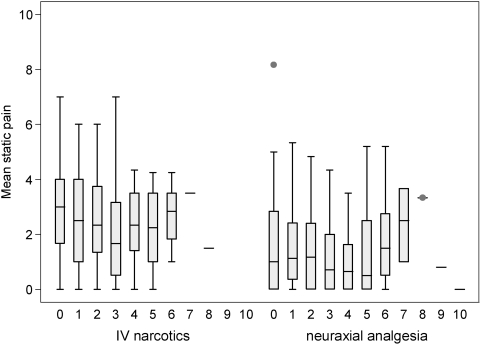
Figure 4. Box plots of numeric rating scale scores for static pain by group and postoperative day.
The horizontal bars denote the median pain score, the boxes denote the interquartile range, the lower whiskers denote the lowest value lying within the first quartile subtract 1.5 times the interquartile range, the upper whiskers denote the highest value lying within the third quartile plus 1.5 times the interquartile range, and dots denote outliers.

