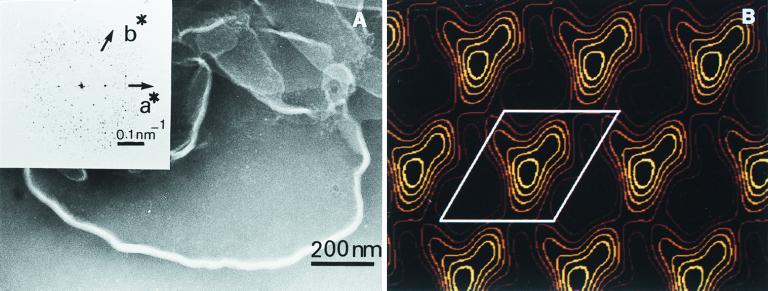
Figure 4.
(A) Electron micrograph of negatively stained MGDG-LHCII membranes. (Inset) The Fourier transform of an area of 256 × 256 pixels ≡ 171.52 nm × 171.52 nm. (B) Fourier projection map of LHCII reconstituted in MGDG. The first four (positive) contour lines were drawn equidistantly between the mean and the maximum density. One unit cell is indicated (a = 6.6 nm, b = 7.2 nm, γ = 121.2°).

