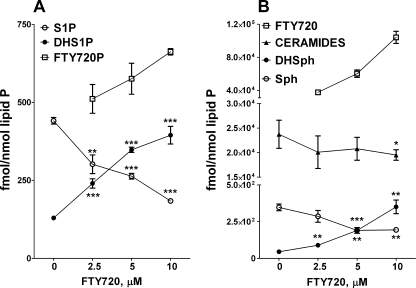
FIGURE 2.
The effect of FTY720 on intracellular level of signaling sphingolipids in HPAEC. Cells were treated with increasing concentrations of FTY720 for 2 h, and S1P, DHS1P, and FTY720-P (A) and Sph, DHSph, ceramides, and FTY720 (B) were quantified by LC/MS/MS. *, p < 0.05; **, p < 0.01; ***, p < 0.001 versus control. Error bars represent S.E.

