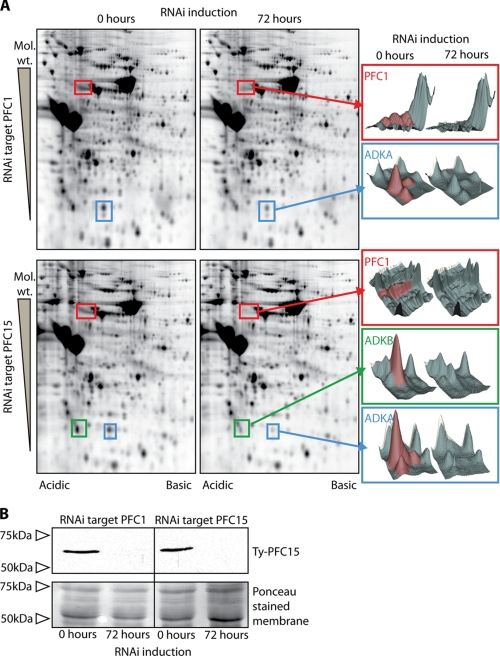
FIGURE 5.
A, two-dimensional DIGE analysis of PFC1 and PFC15 noninduced and induced flagella. The gels were analyzed using Decyder software (GE Healthcare), which was used to generate three-dimensional representations of the spots that show a change in volume after induction. In both RNAi environments, significant reductions in volume were seen for spots corresponding to PFC1 and ADKA. An equally significant volume decrease was observed for ADKB after PFC15 RNAi, but this was not observed after PFC1 RNAi. B, Western blot showing the absence of Ty epitope-tagged PFC15 from the detergent-resistant fraction following RNAi against PFC15 and against PFC1. Ponceau-stained membrane is shown as a loading control.

