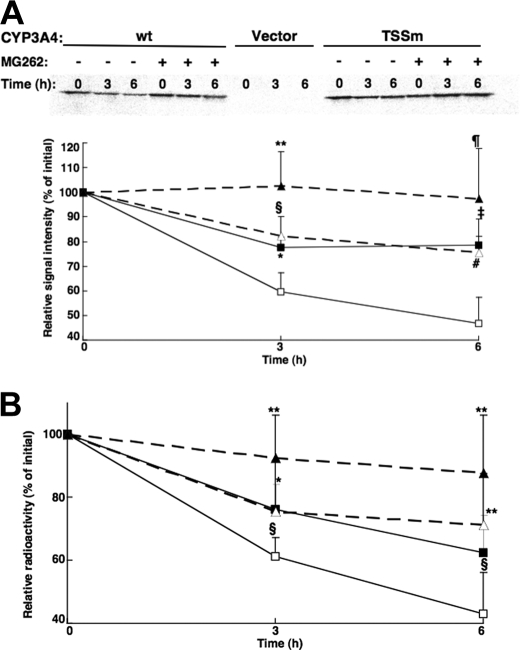
FIGURE 5.
Degradation of CYP3A4wt and its T264A/S420A/S478A mutant (TSSm) by pulse-chase analyses in HEK293T cells. Pulse-chase analyses of HEK293T cells were carried out as detailed after 30 h of transfection of the CYP3A4wt and TSSm expression plasmids and the corresponding vector control, in the presence or absence of the proteasome inhibitor, MG262 (10 μm). At 0, 3, and 6 h after the chase, cells were harvested and lysates subjected to CYP3A4 immunoprecipitation as detailed (see under “Experimental Procedures”). Aliquots of CYP3A4 immunoprecipitates were subjected to SDS-PAGE analyses and PhosphorImager scanning. A representative scan is shown in A. The corresponding 35S-labeled CYP3A4 over the time course was monitored using ImageJ software. Values depicted represent the mean ± S.D. of three individual experiments. Open symbols represent CYP3A4wt (□) and its TSSm mutant (Δ) from cells treated without MG262. Closed symbols (▪, ▴) represent the corresponding values from cells treated with MG262. Statistically significant differences at p < 0.05 were observed between CYP3Awt ± MG262 (*), TSSm ± MG262 (**), and CYP3Awt versus TSSm (§) at 3 h, and between TSSm ± MG262 (¶) at 6 h. Statistically significant differences at p < 0.01 were observed between CYP3Awt ± MG262 (‡) and CYP3Awt versus TSSm (#) at 6 h. B, aliquots of 35S-CYP3A4 immunoprecipitates were also monitored by scintillation counting. Values depicted represent the mean ± S.D. from the three individual experiments in A. Statistically significant differences at p < 0.05 were observed between CYP3Awt ± MG262 (*), TSSm ± MG262 (**), and CYP3Awt versus TSSm (§) at 3 and 6 h.

