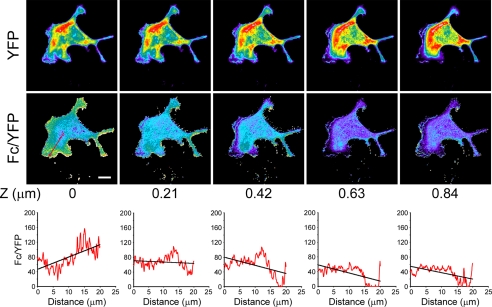
FIGURE 2.
PKA gradients are restricted to the basal surface of the cell. Cells expressing AKAR1 were treated as in Fig. 1A and analyzed for FRET over several planes along the z axis at an interval of 0.21 μm. Note that the PKA gradient is seen only in the most basal portion of the cell. Graphics represent the average pixel intensity of the Fc/YFP ratio versus the distance in microns as displayed in Fig. 1. The bar in the left-hand Fc/YFP indicates 10 μm.

