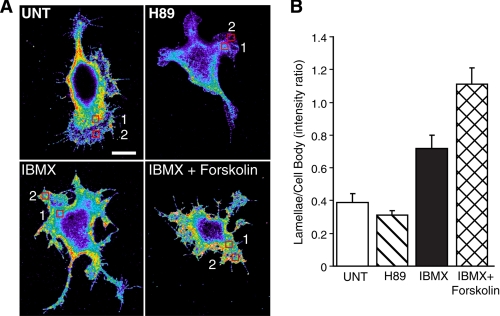
FIGURE 4.
Immunocytochemistry for phospho-PKA substrates. A, Clone A cells were left untreated (UNT) or pretreated with 15 μm H89, 1 mm IBMX, or 1 mm IBMX plus 25 μm forskolin and then plated on laminin-1-coated coverslips in the presence of drug. After 45 min cells were fixed and then immunostained for phospho-PKA substrates as described under “Experimental Procedures.” Cells were then imaged by confocal microscopy under the same conditions including the gain and exposure times. Cells shown here were imaged on the same day. The bar in the untreated panel indicates 10 μm and is representative of the scale for all images. B, regional analysis was performed to compare immunostaining intensity between each condition. Graphics represent the average ratio of intensity of an area taken at the leading edge of the cell (region 2) relative to an area in the cell body (region 1) from 10 different cells from at least two different coverslips. Error bars represent S.E.

