
Figure 2.
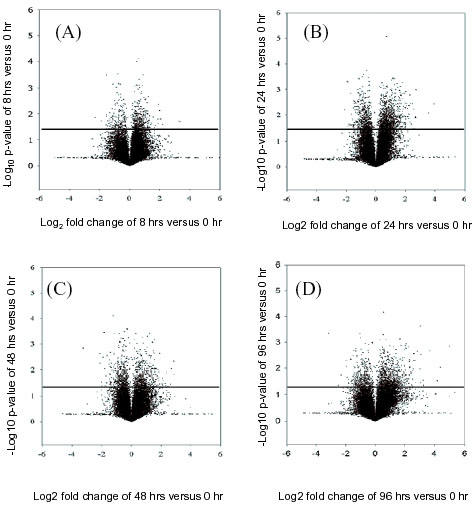
Volcano plot of normalized median intensities of retinal ganglion cells serum-deprived. The Volcano plots show differentially expressed genes at 8 h versus 0 h (A), 24 h versus 0 h (B), 48 h versus 0 h (C), and the 96 h versus 0 h (D) samples. The gene-specific F-test (y-axis) denoting significance for each gene is represented as individual spot (Σ). The Volcano plots allowed the visualization of fold-change and statistically significant p-values at the same time. Thus, the statistical significance of either large or small fold changes can be seen. Volcano Plots show genes that have significantly different expression between two sample types based on both biological difference (absolute log2 (estimated fold change) greater than some constant threshold) and statistical difference (-log10 (p value) greater than some constant threshold). Volcano plots have a "V" shape appearance so there will usually be no genes with small biological effect (i.e., log (fold change) close to 0) with high statistical significance.