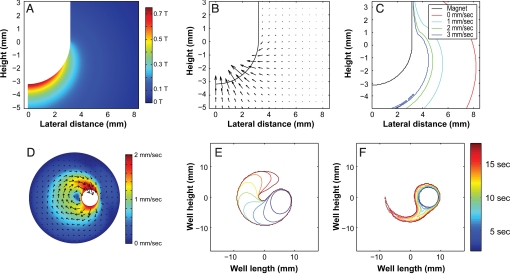
Fig. 2.
Numerical simulations for assessing cell transport and capture. (A) The magnetic flux density magnitude along a radial slice of the magnet immersed in the solution (−5 mm < z < 3 mm). Note the peak magnetic flux density is 0.75 T, which exceeds the specified surface field for the blunt-tip magnet by 0.25 T. Thus, the rounded tip both increases the surface field and the surface area for capture relative to the blunt-tip magnet. (B) The resulting magnetic velocity field for 10-μm-diameter cells labeled with a single 4.5-μm-diameter superparamagnetic particle. For scale, the maximum plotted velocity vector is 7.8 mm/sec (at r = 2 mm, z = −2.5 mm). Note, the true maximum occurs adjacent to the magnet surface at the tip (≈12 mm/sec). (C) Lateral trapping boundaries for an idealized fluid-porous magnet as a function of magnet velocity. We see that particles at the bottom of the well are captured at a distance of 4 mm at 1 mm/sec, but only 2 mm at 3 mm/sec (note that the 0 mm/sec case assumes a capture time of 20 sec). (D) Fluid velocity within the well calculated for a magnet velocity of 2 mm/sec and orbit radius of 6 mm. The vectors indicate the instantaneous flow velocity in the xy-plane near the top of the curved section of the magnet (z = −0.2 mm), and the color gives the flow magnitude. The fluid velocity field was used to calculate particle trajectories and capture times. (E) Cell-trapping profiles in the xy-plane located beneath the magnet near the bottom of the well (z = −4.8 mm). (F) Cell-trapping profiles at the fluid surface (z = 3.5 mm).

