
Figure 3.
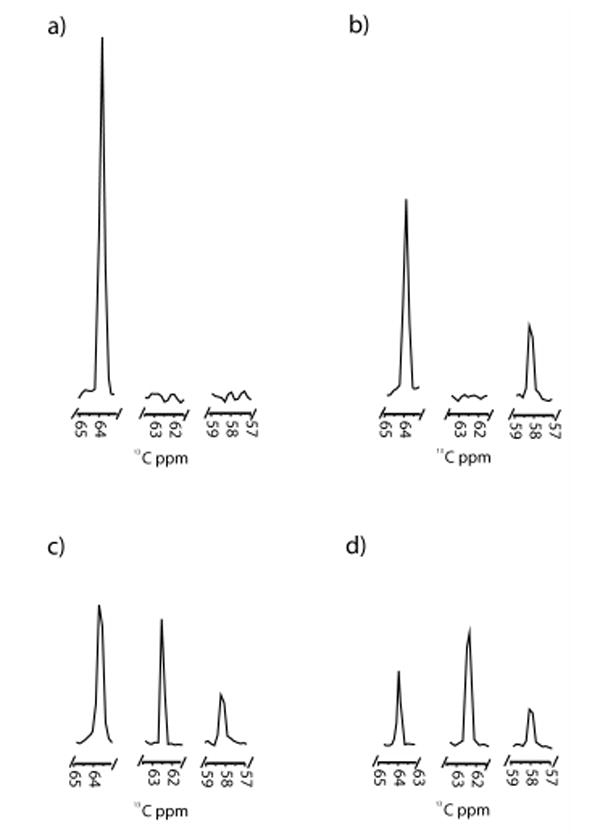
1D slices from the 13C axis of the 1H,13C-HSQC spectra of CYP119-F153-13CMeOF with a) 0 M equivalents of 4-PI, b) 0.3 M equivalents of 4-PI, c) 0.6 M equivalents of 4-PI, and d) 1.2 M equivalents of 4-PI. Slices were taken at the mid-point of the resonance in the 1H dimension. All figures are scaled relative to the same y-axis.