
Figure 3.
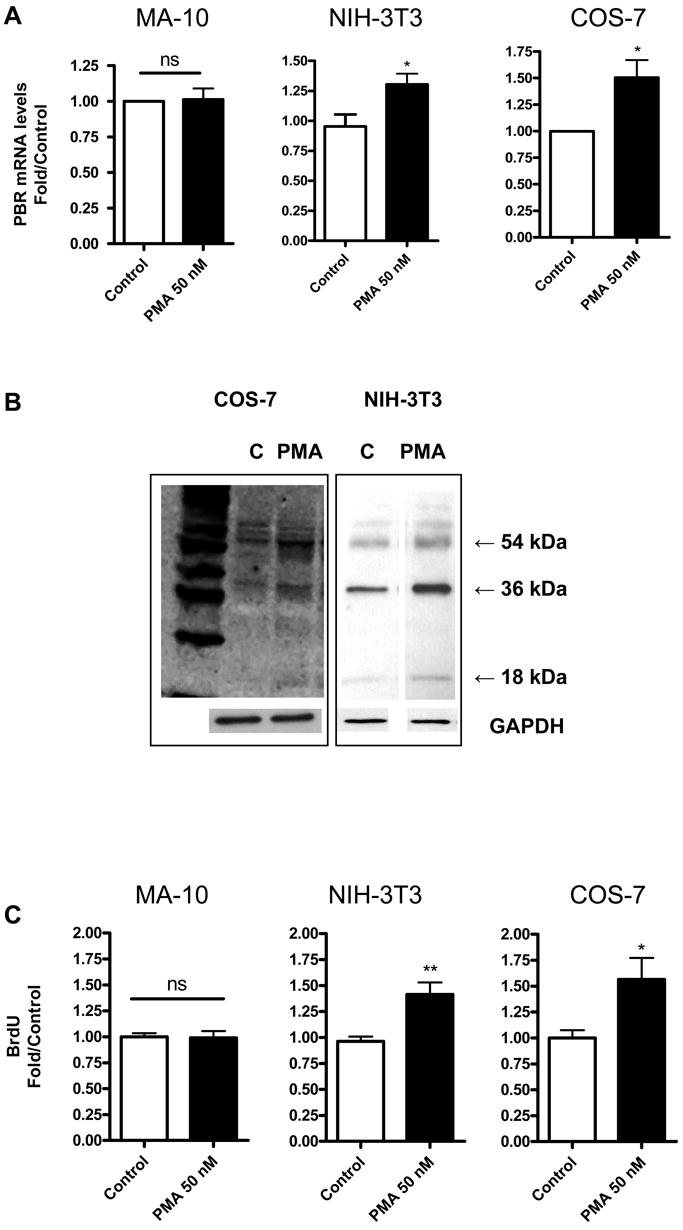
PMA induces TSPO mRNA levels, protein levels and proliferation in NIH-3T3 and COS-7 cells. (A) QRT-PCR analysis of TSPO mRNA levels 24 h after PMA treatment. (B) Immunoblot analysis of NIH-3T3 and COS-7 cells treated with and without PMA (50 nM) for 24 h. (C) Cellular Brdu incorporation 24 h after PMA treatment. Results are derived from three independent experiments (n = 9). *p < 0.05 and **p < 0.01 vs. control; ns, non significant. Immunoblots (B) are representative of three independent experiments.