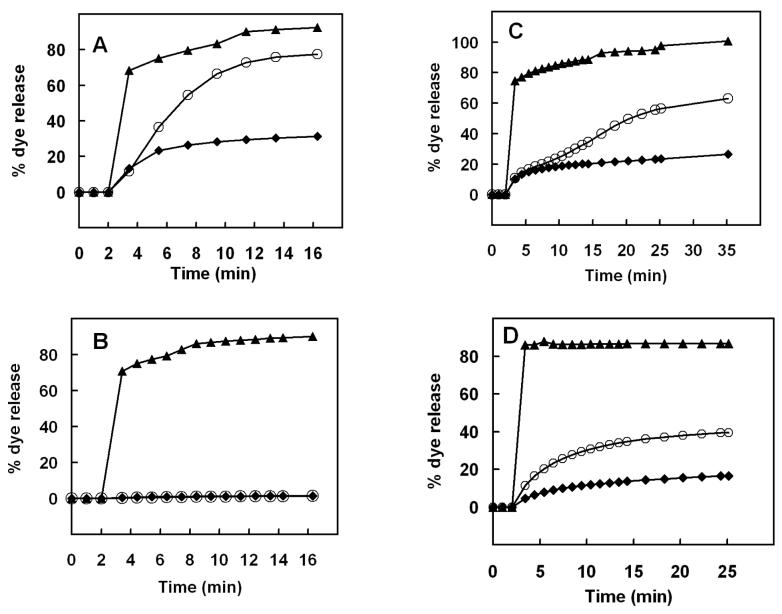
FIGURE 2.
Time course of dye leakage from (A) PE/PG (3:7, 70% charge), (B) PE/PG (7:3, 30% charge), (C) E. coli (∼35% charge) and (D) PE/PG/CL (7:1:1, 30% charge) liposomes induced in the presence of (▲) melittin (2 μM), (◆) (6C/A)-Crp4 (5.9 μM) and (○) native Crp4 (5.9 μM).. The leakage is measured over the entire 90 min course of the assay (usually a plateau was reached within the first 15 min) with peptides and liposomes mixed at t = 2 min. An increase in fluorescence corresponds to the release of dye and is indicative of liposome leakage or lysis. A result average of three independent experiments is shown for each liposome preparation.

