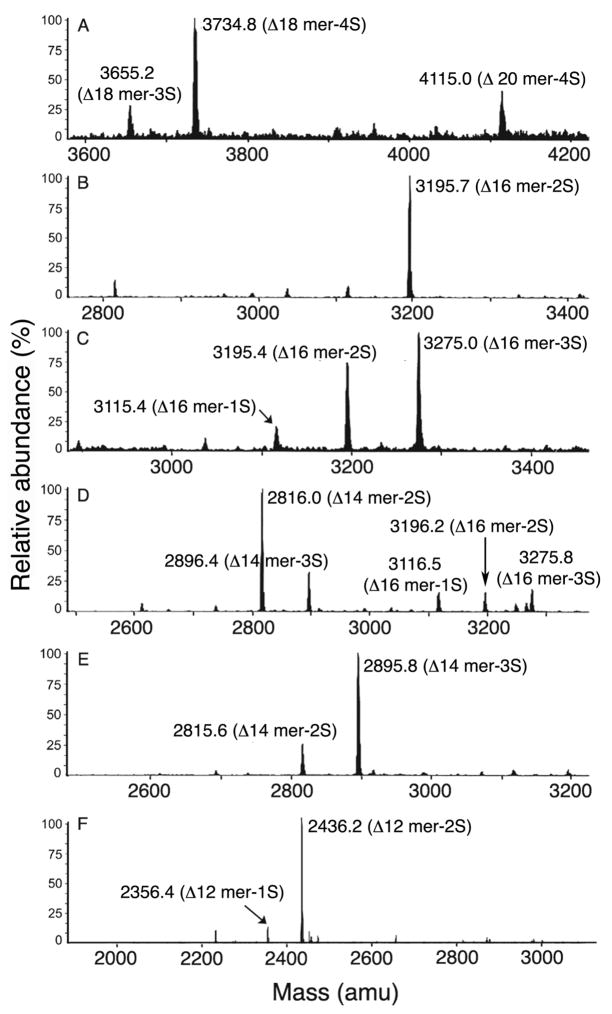
FIGURE 7.
Mass spectral analysis of C4S Δ-oligosaccharide subfractions obtained by HPLC of S. dysgalactiae hyaluronidase digestion products of C4S (see Figure S3 of the supporting information). Panel A, B, C, D, and E, respectively, represent mass spectrum of subfractions III-F25c, III-F26b, III-F26c, III-F28b, III-F28c, and III-F31b. The data is summarized in Table 2.

