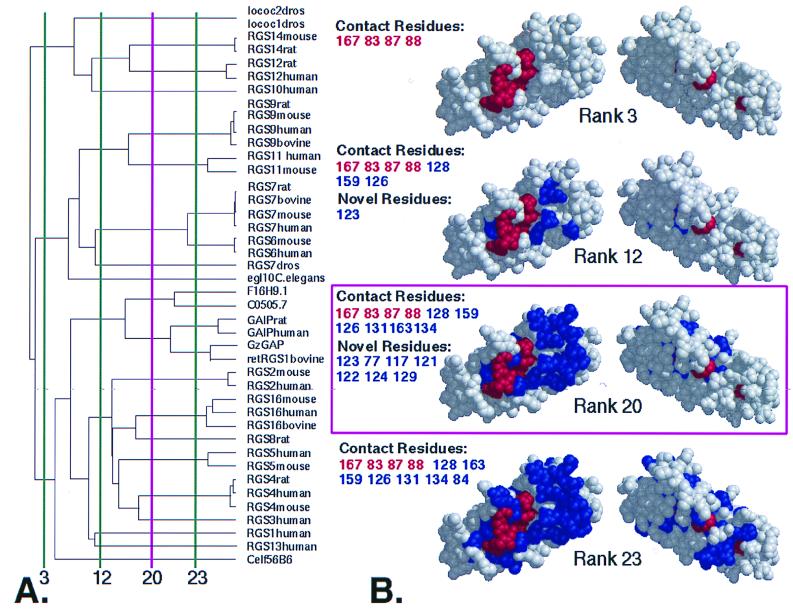
Figure 1.
ET of the RGS protein family. (A) Dendrogram of metazoan RGS domains. Vertical lines divide the tree into the specified number of branches (called ranks) and indicate functional resolution of ET at those points. The minimum number of branches at which a residue becomes invariant within each branch determines its rank (see Methods). (B) Class-specific residues at the indicated ranks. (View facing the Gα binding surface at left, rotated 180o at right). At a functional resolution < 3, the only class-specific residues identified have rank 1 (i.e., invariant; colored red), but additional class-specific residues of higher rank emerge (colored blue) as the functional resolution increases. Positions of important residues are listed using the same colors, classified as Contact (from RGS4-Giα1 structure) or Novel (newly identified noncontact residues). Rank 20 (shown in magenta) was used for the analysis. [Key for dendrogram: lococ2dros, Drosophilia melanogaster RGS protein Loco C2 (AAD24580); locoC1dros, D. melanogaster RGS protein Loco C1 (AAD24584); retRGS1, bovine retinal specific RGS protein 1 (P79348); F16H9.1, Caenorhabditis elegans hypothetical protein (P49808); C0505.7, C. elegans hypothetical protein (P34295); Celf56B6, C. elegans protein (AAB04563)].

