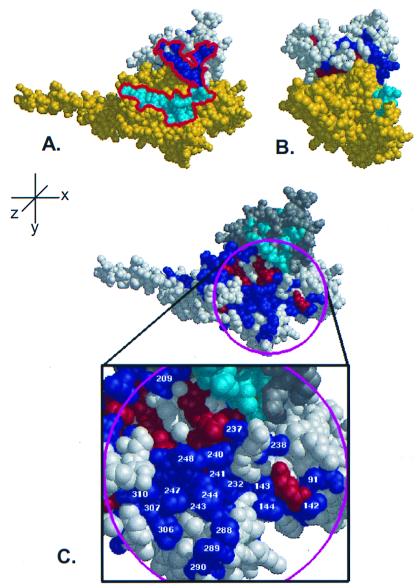
Figure 5.
Class-specific residues cluster in near contiguity with putative PDEγ binding sites. (A) When putative PDEγ binding residues (18) from Gtα (cyan) are mapped onto the surface of the RGS4/Giα1 complex, they form a nearly continuous stretch (red outline) with class-specific residues on the RGS domain (dark blue). (B) Rotation of A by 90° about the y-axis reveals the profile of the proposed effector binding region. (C) ET analysis of Gα reveals a large class-specific effector binding surface in close proximity to ET-identified RGS domain residues. In addition to the known Gβγ and RGS-interacting residues, ET analysis of Gα identifies a large surface that contains residues required for effector binding. The RGS protein is colored in gray with the class-specific shown in magenta and the invariant residues in orange. The Gα protein is shown in white with the class-specific residues labeled blue and the invariant residues labeled red. The magenta circle indicates the area chosen to represent the effector binding surface, and the class-specific residues within this region are labeled according to Giα1.

