Figure 11.

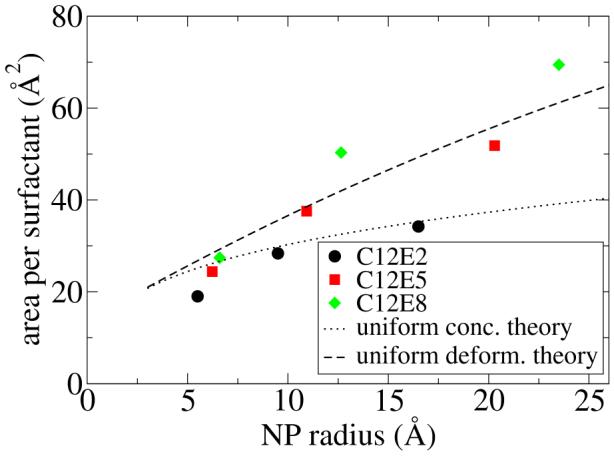
The surface area occupied per ligand chain is plotted versus the NP radius. The MD free energy results are shown with symbols, and the theoretical estimate is shown for C12E8 in two limiting cases.

The surface area occupied per ligand chain is plotted versus the NP radius. The MD free energy results are shown with symbols, and the theoretical estimate is shown for C12E8 in two limiting cases.