
Figure 6. Reduction potential of wild-type Tt H-NOX and P115A.
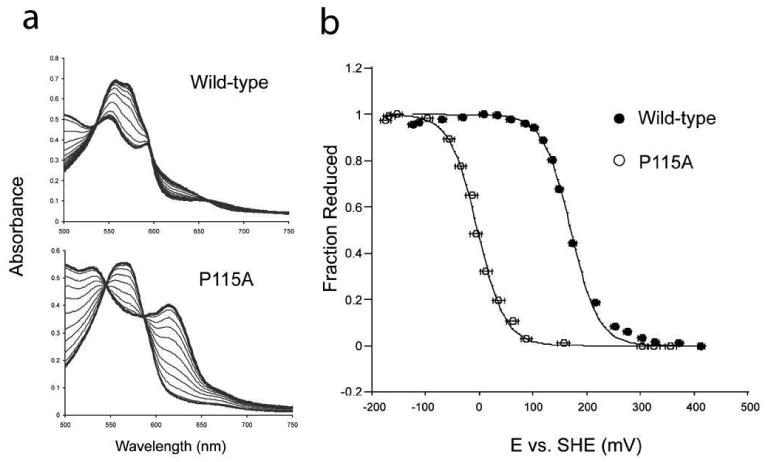
a) Shown are the titration spectra for wild-type Tt H-NOX and P115A. b) Titration curves for wild-type (•) and P115A (o). The reduction potentials of P115A and wild-type Tt H-NOX were determined against the standard hydrogen electrode (SHE). The ratio of reduced Fe2+ to oxidized Fe3+ heme was measured based on their α/β maximum at approximately 557 (reduced) nm for wild-type. The difference absorbance of the α/β maximum for reduced and the α/β minimum for oxidized was used to calculate the fraction reduced for P115A. The voltage against the SHE was measured for both oxidative and reductive titrations of wild-type and P115A. Error bars represent the standard error.