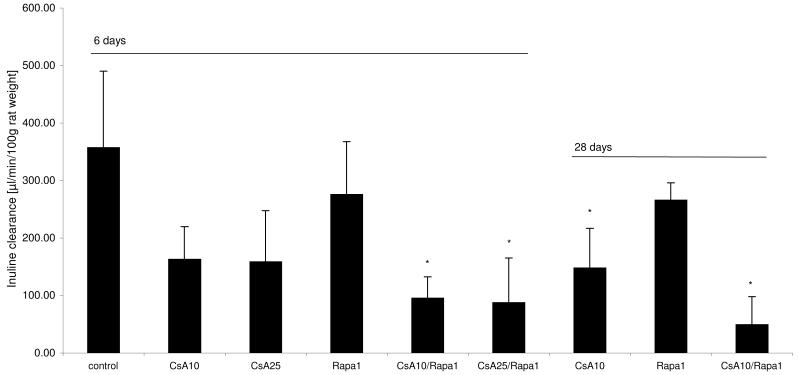
Figure 1.
Change in glomerular filtration rates (GFR) in the different treatment groups (all GFR values corrected for animal body weight and presented as means + standard deviations (n=6/group)), differences between groups was significant at p<0.001 (one-way ANOVA) *significant compared to untreated controls using a post-hoc pairwise multiple comparison (Holm-Sidak method).
Groups: con: vehicle-treated controls, CsA10: 10 mg/kg/day cyclosporine, CsA25: 25 mg/kg/day cyclosporine, Rapa1: 1 mg/kg/day sirolimus, CsA10/Rapa1: co-administration of 10 mg/ kg/ day cyclosporine and 1 mg/kg/day sirolimus, CsA25/Rapa1: co-administration of 25 mg/kg/day cyclosporine and 1 mg/kg/day sirolimus.

