
Figure 9. Representative 1H-NMR spectra (aromatic region) of urine extracts after treatment for 28 days.
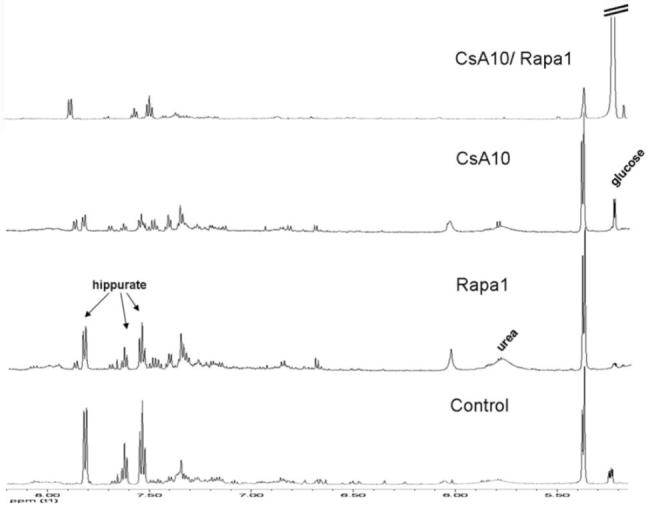
The total number of urine samples evaluated for each group was n=6. Glucose, urea and hippurate signals are shown.
Groups: con: vehicle-treated controls, CsA10: 10 mg/kg/day cyclosporine, CsA25: 25 mg/kg/day cyclosporine, Rapa1: 1 mg/kg/day sirolimus, CsA10/Rapa1: co-administration of 10 mg/ kg/ day cyclosporine and 1 mg/kg/day sirolimus, CsA25/Rapa1: co-administration of 25 mg/kg/day cyclosporine and 1 mg/kg/day sirolimus.