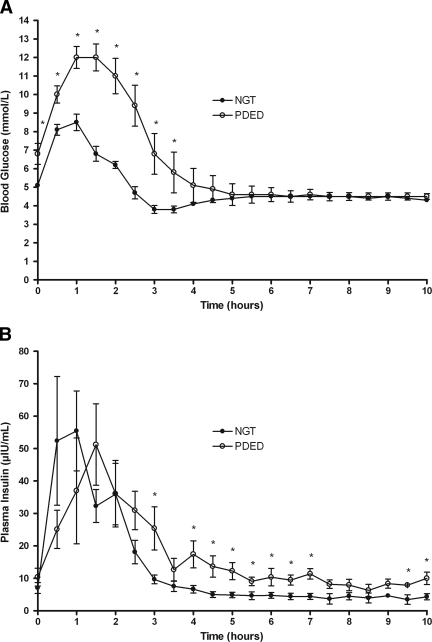
Figure 2.
Blood glucose and plasma insulin concentrations in individuals with NGT and PDED during the 10-h OGTT. A: Blood glucose was different between individuals with NGT and PDED over time as determined by mixed-model repeated measures (P < 0.05). *Different between individuals with NGT and PDED (t test, P < 0.05). B: Plasma insulin was different between individuals with NGT and PDED over time as determined by mixed-model repeated measures (P < 0.05). *Different between individuals with NGT and PDED (t test, P < 0.05).

