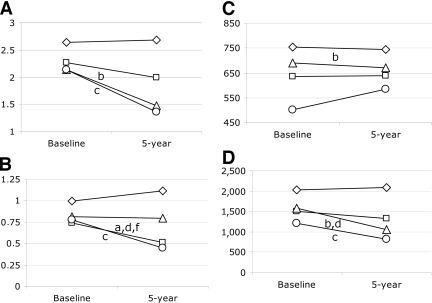
Figure 1.
Baseline and 5-year values of ISI (A), HOMA-IS (B), EPIR (C), and DI (D) in 3,145 individuals developing i-IFG (□), i-IGT (▵), or IFG/IGT (○) or maintaining NGT status (⋄). Data are presented as medians. P values for differences in changes (5-year minus baseline) between groups are adjusted for age, sex, family history of diabetes, and risk/intervention group as well as for changes in BMI, smoking, physical activity, and dietary quality during the 5 years of follow-up. Wald test from linear models (P < 0.05): a, i-IFG vs. NGT; b, i-IGT vs. NGT; c, IFG/IGT vs. NGT; d, i-IGT vs. i-IFG, e, IFG/IGT vs. i-IFG; f, IFG/IGT vs. i-IGT.

