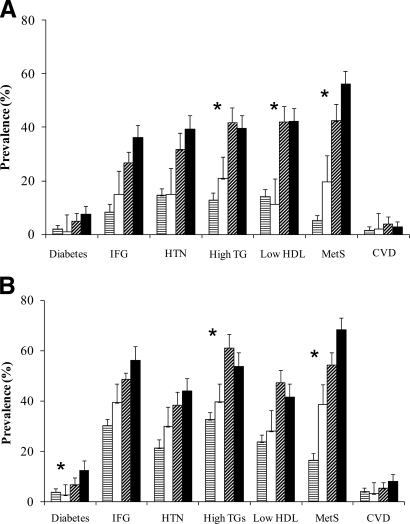
Figure 3.
Prevalence of metabolic risk factors (MetS) and CVD by SAT/VAT concordant and discordant categories in women (A) and men (B). Age-adjusted P < 0.0001 across all four categories for each risk factor except cardiovascular disease (P = 0.01 for men and P = 0.05 for women). *P < 0.01 for the low SAT/high VAT and high SAT/low VAT comparisons. Error bars represent upper one-sided 97.5% CIs. HTN, hypertension; IFG, impaired fasting glucose; TG, triglyceride.  , low SAT and VAT; □, high SAT and low VAT;
  , low SAT and high VAT; ▪, high SAT and VAT.

