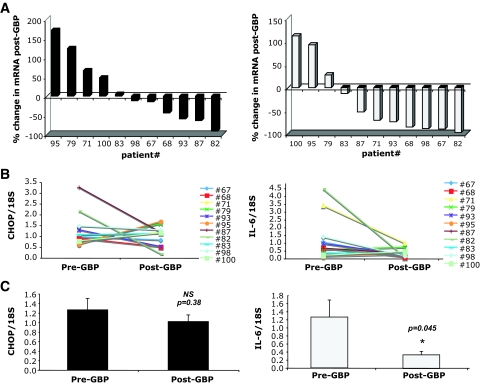
FIG. 4.
CHOP (left panel) and IL-6 (right panel) mRNA levels in GBP subjects. Quantitative RT-PCR was performed on RNA isolated from adipose tissue of patients before and after GBP, n = 11. A: Percent change in CHOP and IL-6 mRNA from pre-GBP levels in each individual patient. B: Pre- and post-GBP levels of CHOP and IL-6 mRNA normalized to 18S ribosomal RNA. C: Average mRNA levels for CHOP and IL-6 in pre- and post-GBP groups. Data indicate means ± SE. *P < 0.05.

