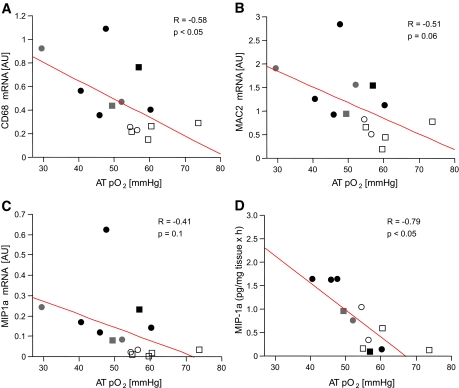
FIG. 3.
Hypoxia and AT inflammation. AT pO2 was inversely correlated with the inflammation markers CD68 mRNA (A) and MAC 2/CD163 mRNA (B), with the chemokine MIP1α mRNA expression (C) and MIP1α secretion into culture media ex vivo (D). Previous studies in our lab demonstrated a strong correlation between MAC2/CD163 and CD68 mRNA and macrophage infiltration by macrophage staining in AT sections by immunohistochemistry (R2 = 0.77, P < 0.001) (B. Kozak, J. Gimble, S.R. Smith, unpublished data). Males are represented by squares and females by circles, filled with different colors as follows: white for lean, gray for O/O without type 2 diabetes, and black for O/O with type 2 diabetes.

