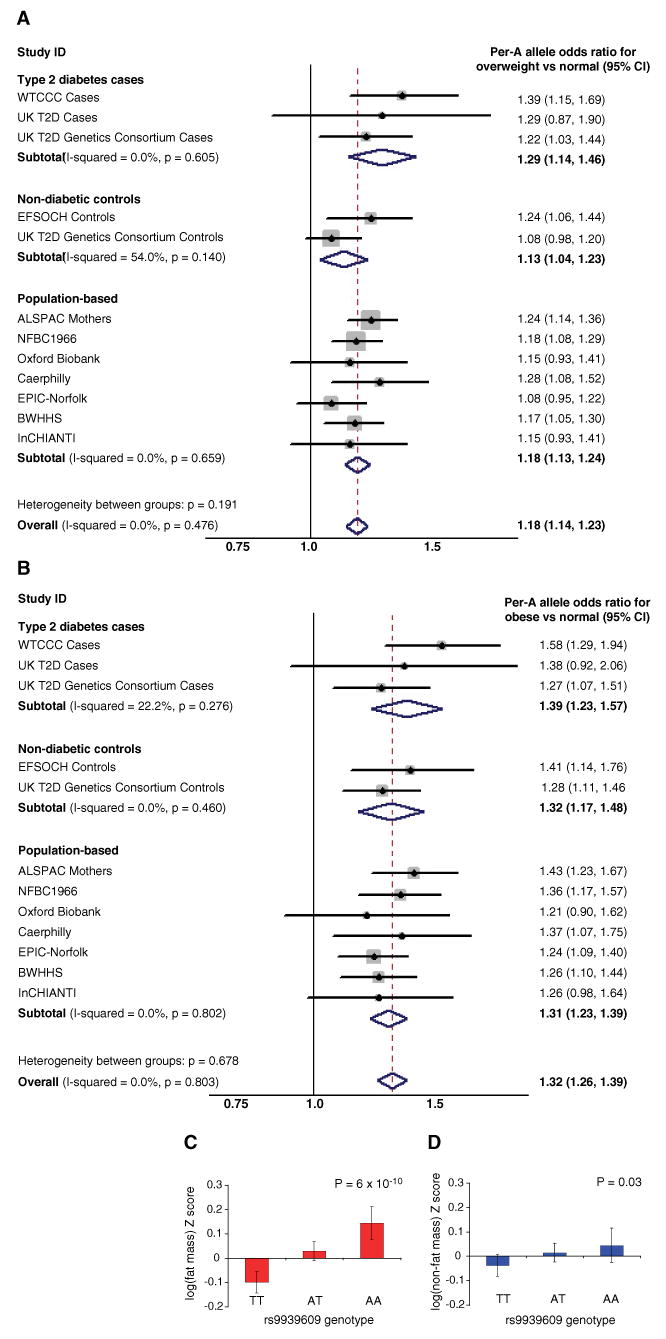
Fig. 2.

(A and B) Meta-analysis plots for odds of (A) overweight and (B) obesity, compared with normal weight in adults for each copy of the A allele of rs9939609 carried. (C and D) Bar charts showing (C) DEXA-measured fat mass in 9-year-old children and (D) DEXA-measured lean mass in 9-year-old children, both from the ALSPAC study. Error bars represent 95% confidence intervals
