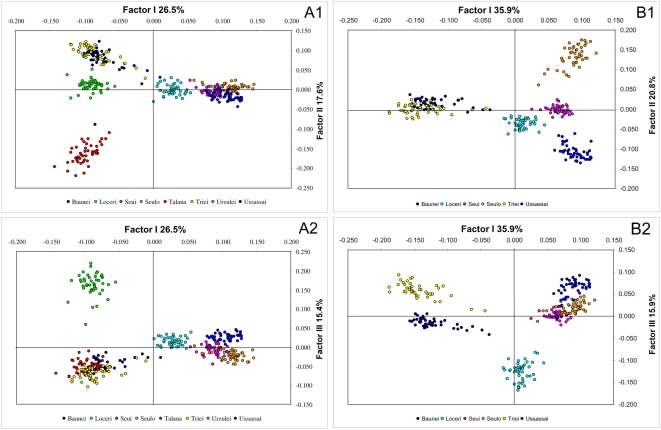
Figure 8. Factor Correspondence Analysis comparing different individuals from different Ogliastra villages, performed with 5,192 SNPs.
Each individual is represented by a circular shape, and the different 8 communities are marked with different colours. The two plots represented factor 1 and 2 and factor 1 and 3. (A1, A2) Analysis performed with 8 communities; (B1, B2) Analysis performed with 6 communities, without Talana and Urzulei.

