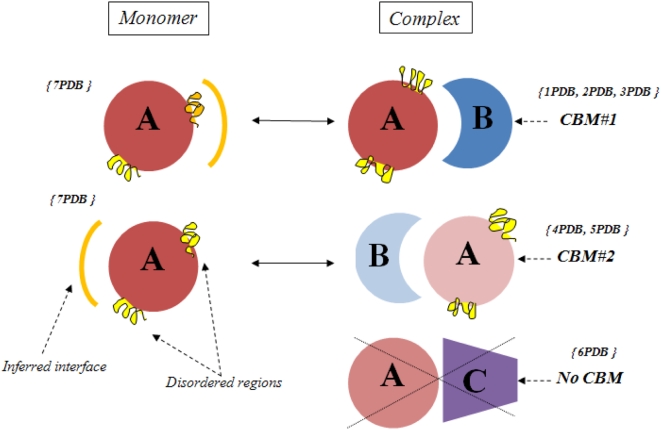
Figure 2. Diagram illustrating the definition of conserved binding modes and construction of the test set.
Structures 1PDB , 2 PDB and 3PDB have a recurrent mode of interaction between families A and B, this constitutes CBM#1. Structures 4PDB and 5PDB use another binding mode which is also conserved between two different structures and therefore constitutes CBM#2. There is only one instance of binding mode between family A and C, therefore it is not a CBM. Structures of two different representatives of family A in complex and monomeric forms are shown. Interface regions mapped from complex to monomer are shown as orange arcs and disordered regions on the inferred interface regions are shown in orange, all other disordered regions are shown in yellow. Fraction disorder in family A in a complex state is calculated by averaging over all structures of a given CBM (1PDB, 2PDB, 3PDB for CBM#1 and 4PDB, 5PDB for CBM#2).

