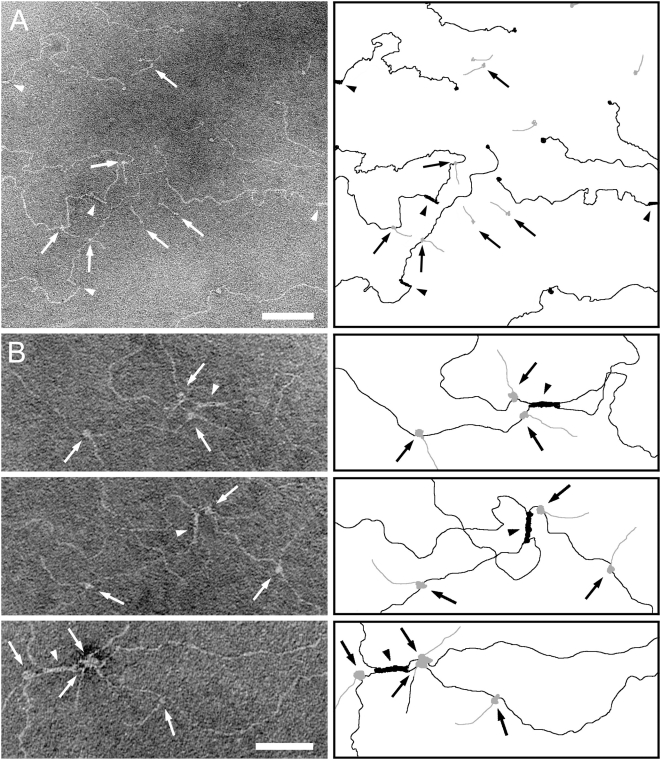
Figure 1. Electron microscopy of M3-CIV complexes.
Micrographies (left panel) and corresponding cartoons (right panel) show complexes that consist of M3-protein and CIV. Block arrows highlight M3-protein (depicted in gray in the cartoons), both free and bound to CIV (depicted in black in the cartoons). Arrow heads point out the 7S regions of CIV, while line arrows points out the globular heads of the CIV molecules. The bars represent 100 nm in the representative overviev (A) and 50 nm in the panel of selected complexes (B).

