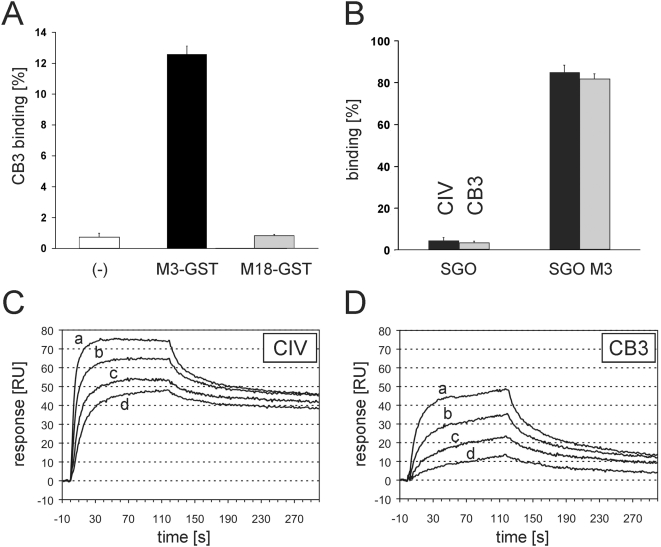
Figure 2. CB3 binding by M3-protein.
(A) Interaction with 125I-CB3 was measured in a pull-down assay with, M3-GST (black bar), or M18-GST (grey bar) protein coupled to glutathion sepharose beads. A control sample with glutathion separose alone (−) was included (white bar). (B) Binding of 125I-CIV (black bars) or 125I-CB3 (grey bars) to S. gordonii that heterologously expressed M3 protein on its surface (SGO M3) and that of the wild type control (SGO) was expressed as a percentage of total radioactivity input. Error bars in A and B represent the standard deviation of the triplicate measurements. (C and D) Surface plasmon resonance measurements of the interaction between M3-protein and immobilized CIV (C) or CB3 (D), respectively. Injection of M3-protein at different concentrations (a: 50 µg/ml, b: 25 µg/ml, c: 12.5 µg/ml, d: 6.25 µg/ml) started at t = 0 s and stopped at t = 120 s. The response is expressed in response units (RU).

