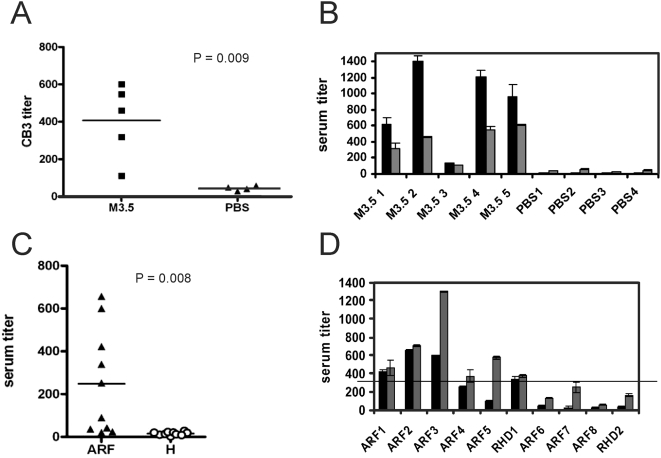
Figure 4. CIV and CB3 specific serum responses.
(A) Serum Ig response for CB3 in M3.5 immunized mice. Reactivity was determined for sera from PBS-immunized (PBS) or M3-protein-immunized (M3.5) mice. The anti-CIV (black bars) and anti-CB3 titers (grey bars) measured in individual mice immunized with M3.5 (M3.5 #) or PBS (PBS #) are compared in (B). (C) Anti-CB3 titer of individual patient sera. Titers are shown for each individual serum collected from ARF/RHD patients (triangles), or healthy individuals (circles). The significance of the differences measured in A and C was examined using the t-test. (D) The six sera of patients with CB3 autoimmunity (black bars) showed also reactivity against the collagen binding part of M3-protein (M3.5) (grey bars). The horizontal line indicates the cut-off titer for M3.5 positive sera. Error bars represent the standard deviation of the triplicate measurements in B an D.

