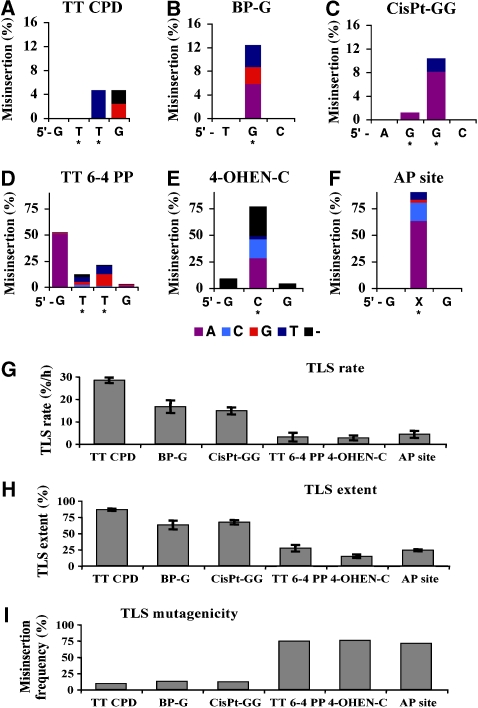
Figure 2.
Mutagenicity of TLS across six different types of DNA damage in human U2OS cells. Individual colonies from the TLS reactions presented in Figure 1 were picked, and their plasmid content was analysed for mutations in the DNA region corresponding to the original site of the lesion. The cumulative height of each column represents the misinsertion frequency opposite the corresponding lesion, whereas the coloured column sections represent specific mutational events, colour coded as shown underneath. The DNA sequence with the damaged bases (marked by stars) is shown in the 5′ → 3′ direction. The detailed DNA sequence data are presented in Supplementary Tables 7s–12s. Results are presented for mutations formed at TT CPD (A), BP-G (B), cisPt-GG (C), TT 6-4 PP (D), 4-OHEN-C (E), and AP site (F). (G) TLS rates, calculated for the linear TLS phase of each lesion from the data presented in Figure 1, namely 0–2 h for TT CPD, TT 6-4 PP, 4-OHEN-C and the AP site, and 2–4 h for BP-G and cisP-GG, are shown. (H) Maximal values of TLS for the six lesions measured at 24 h are shown. The data were taken from Figure 1 and Supplementary Tables 1s–6s. (I) Mutagenic TLS out of total TLS events. For the AP site, insertion of A or G was taken as a mutagenic event. The data were taken from Figures 1 and 2, and Supplementary Tables 1s–12s.

