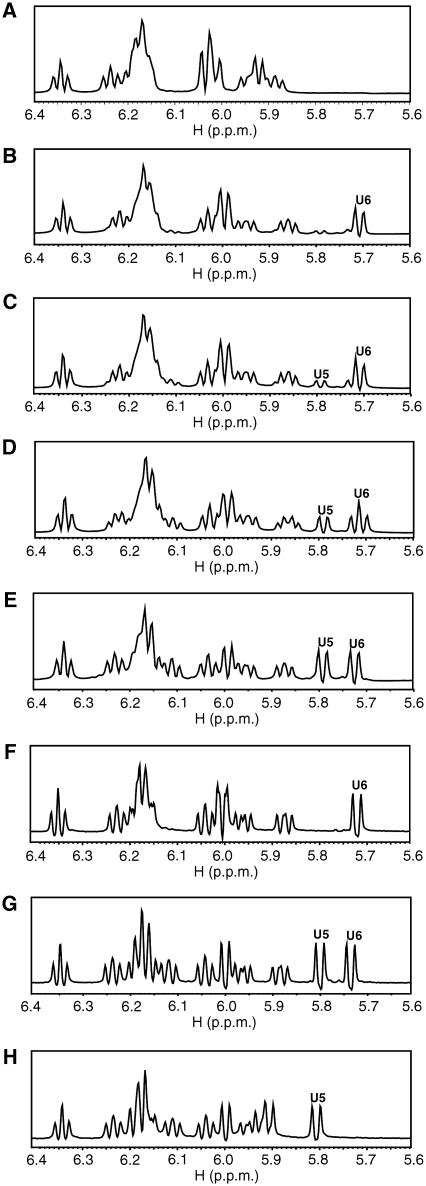
Figure 6.
Time chase of 1H NMR spectra indicating deamination of two cytidine residues in a strict 3′ → 5′ order. 1H NMR spectrum of 10-mer DNA (A), and ones recorded 0.5 h (B), 1.5 h (C), 4.5 h (D) and 24 h (E) after the addition of the wild-type deaminase domain to the NMR tube. 1H NMR spectra of mutant 10-mer DNAs with the C4C5U6 (F), C4U5U6 (G) and C4U5C6 (H) segments, respectively, for reference.

