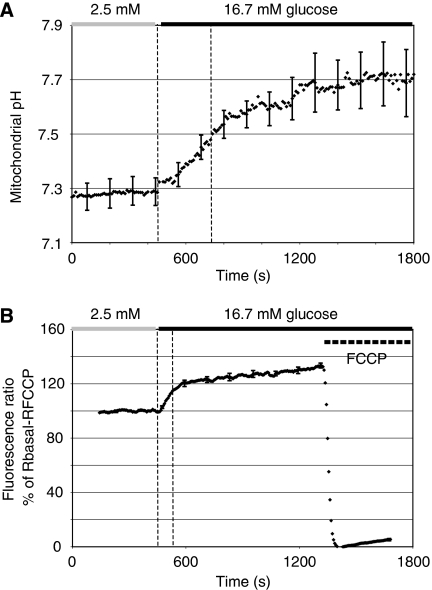
Figure 7.
Kinetic comparison of matrix alkalinisation and the increase of the mitochondrial electrical potential. INS-1E cells expressing mtAlpHi (A; N=6) or loaded with JC-1 (B; N=7) were stimulated with 16.7 mM glucose. For clarity, standard errors are included only every 120 s. FCCP (10 μM) was used to depolarise the mitochondria.

