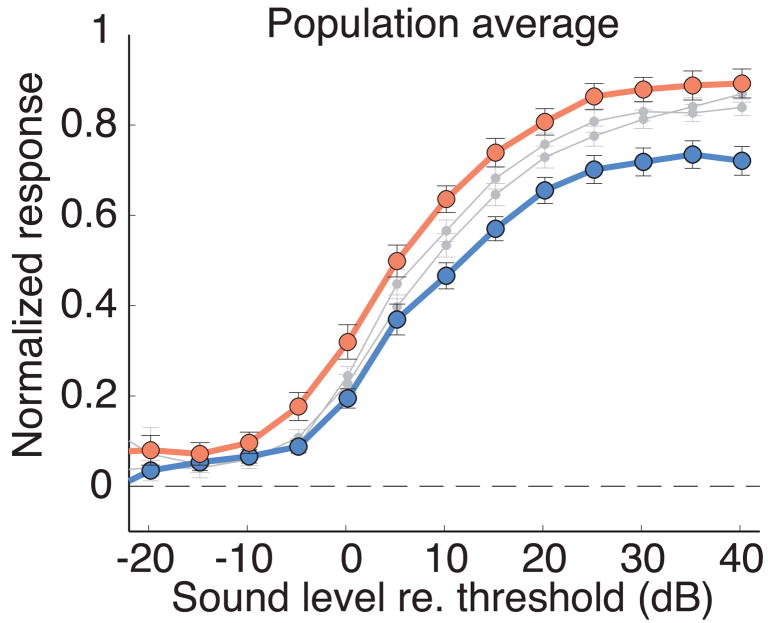
Figure 5.
Overall effect of AGFa microstimulation on neural gain and sensitivity in the OT. The red curve is the population average, level-response function with AGFa stimulation at aligned sites (from Fig. 1D), and the blue curve is the population average, level-response function with AGFa stimulation at nonaligned sites (from Fig. 2D). Gray curves are the average level-response functions without AGFa stimulation. The blue curve is analogous to “attend away”; the red curve is analogous to “attend toward”.

