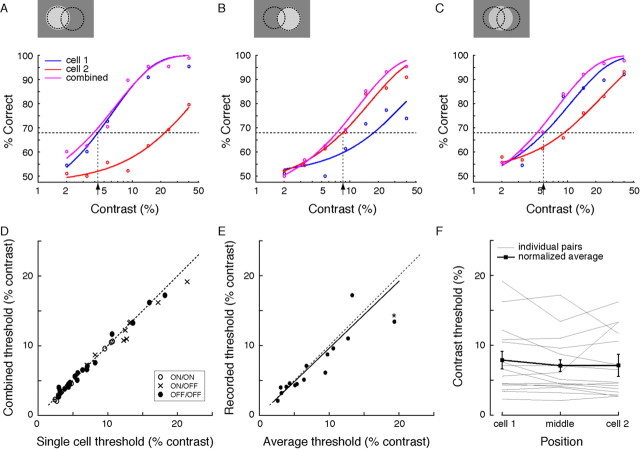
Figure 5.
Single-cell threshold for contrast detection does not improve by adding the response of a neighbor. Recording from a ganglion cell pair, a spot of optimal size was presented over the center or midway between either cell. An ideal observer detected the spot based on the response of either cell alone, or combined. The task of the ideal observer was to detect nonzero contrast in a single-interval, two-alternative, forced-choice paradigm. A, B, Graphs show detection performance as the percentage correct choices on the basis of the response of cell 1, cell 2, or both. The dotted line represents detection threshold, set at 68% correct. For a spot centered on one cell, contrast detection was not improved by including the response of the other cell. C, For a spot midway between the two cells, both contribute to detection, but threshold is similar to that for a spot centered on either cell. D–F, Combined contrast thresholds are as low as the best single-cell threshold and constant over space. D, Contrast threshold based on the best single-cell response was the same as that based on the combined responses of neighbors. E, Moreover, the average of the thresholds of the two cells for a centered spot and the recorded threshold for a spot located between them differed by <5% (solid line; linear fit, slope 0.96). Data point marked with * represents an ON/OFF pair with unusually high overlap (for details, see Results). F, Combined contrast threshold was the same for spots centered on and between cells. Thick line shows mean ± 1 SD.

