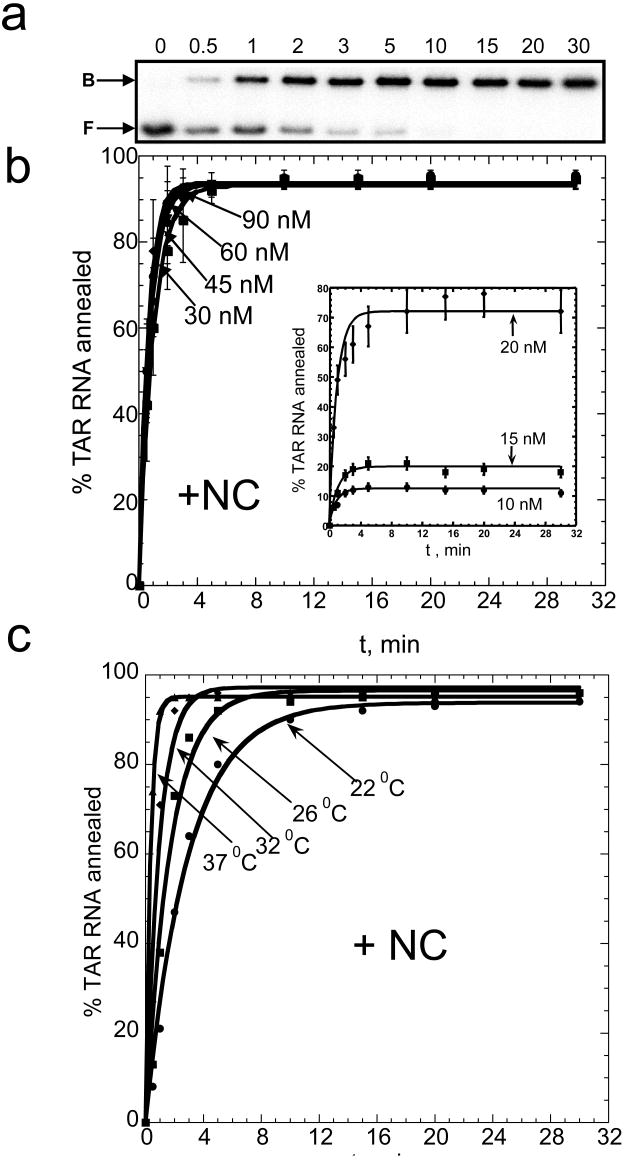
Figure 5.
Time course of TAR RNA/DNA hairpin annealing in the presence of saturating amounts of NC. (a) Typical gel-shift analysis performed with 15 nM TAR RNA and 45 nM TAR DNA. The numbers at the top of each lane correspond to minutes. The positions of bound (B) and free (F) RNA bands are indicated on the left. (b) Time dependence of the percent of TAR RNA (15 nM) annealed to variable concentration of TAR DNA (as indicated by each curve) at 37 °C and a 4:1 nt:NC ratio. The 10-20 nM DNA curves are shown as an inset. (c) TAR RNA/DNA annealing time courses (15 nM TAR RNA+ 45 nM TAR DNA) obtained at different temperatures, as indicated in the Figure. All lines are single-exponential fits of the data.

