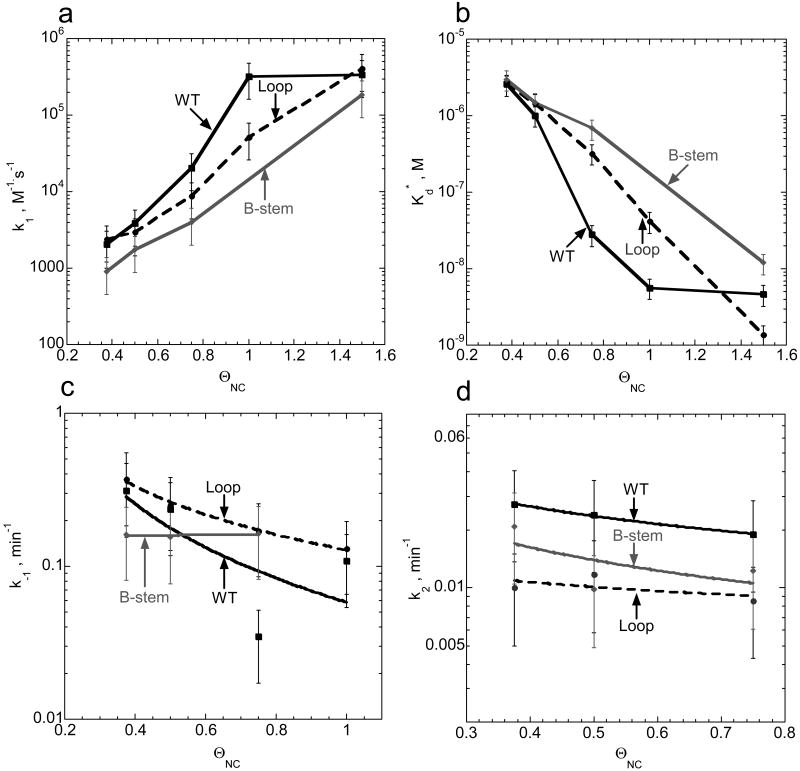
Figure 9.
Comparison of elementary rates (panels a, c, and d) and intermediate dissociation constants (panel b) for annealing of WT and mutant TAR DNA hairpins to TAR RNA in the presence of variable amounts of NC. Fractional NA saturation with NC, ΘNC, was calculated according to eq. (6). Parameters were obtained using equations (2-5) for the analysis of the annealing time courses presented in Figure 8.

